E-commerce
ATLAS.ti Review : What Is It Like to Work At Atlas Software?
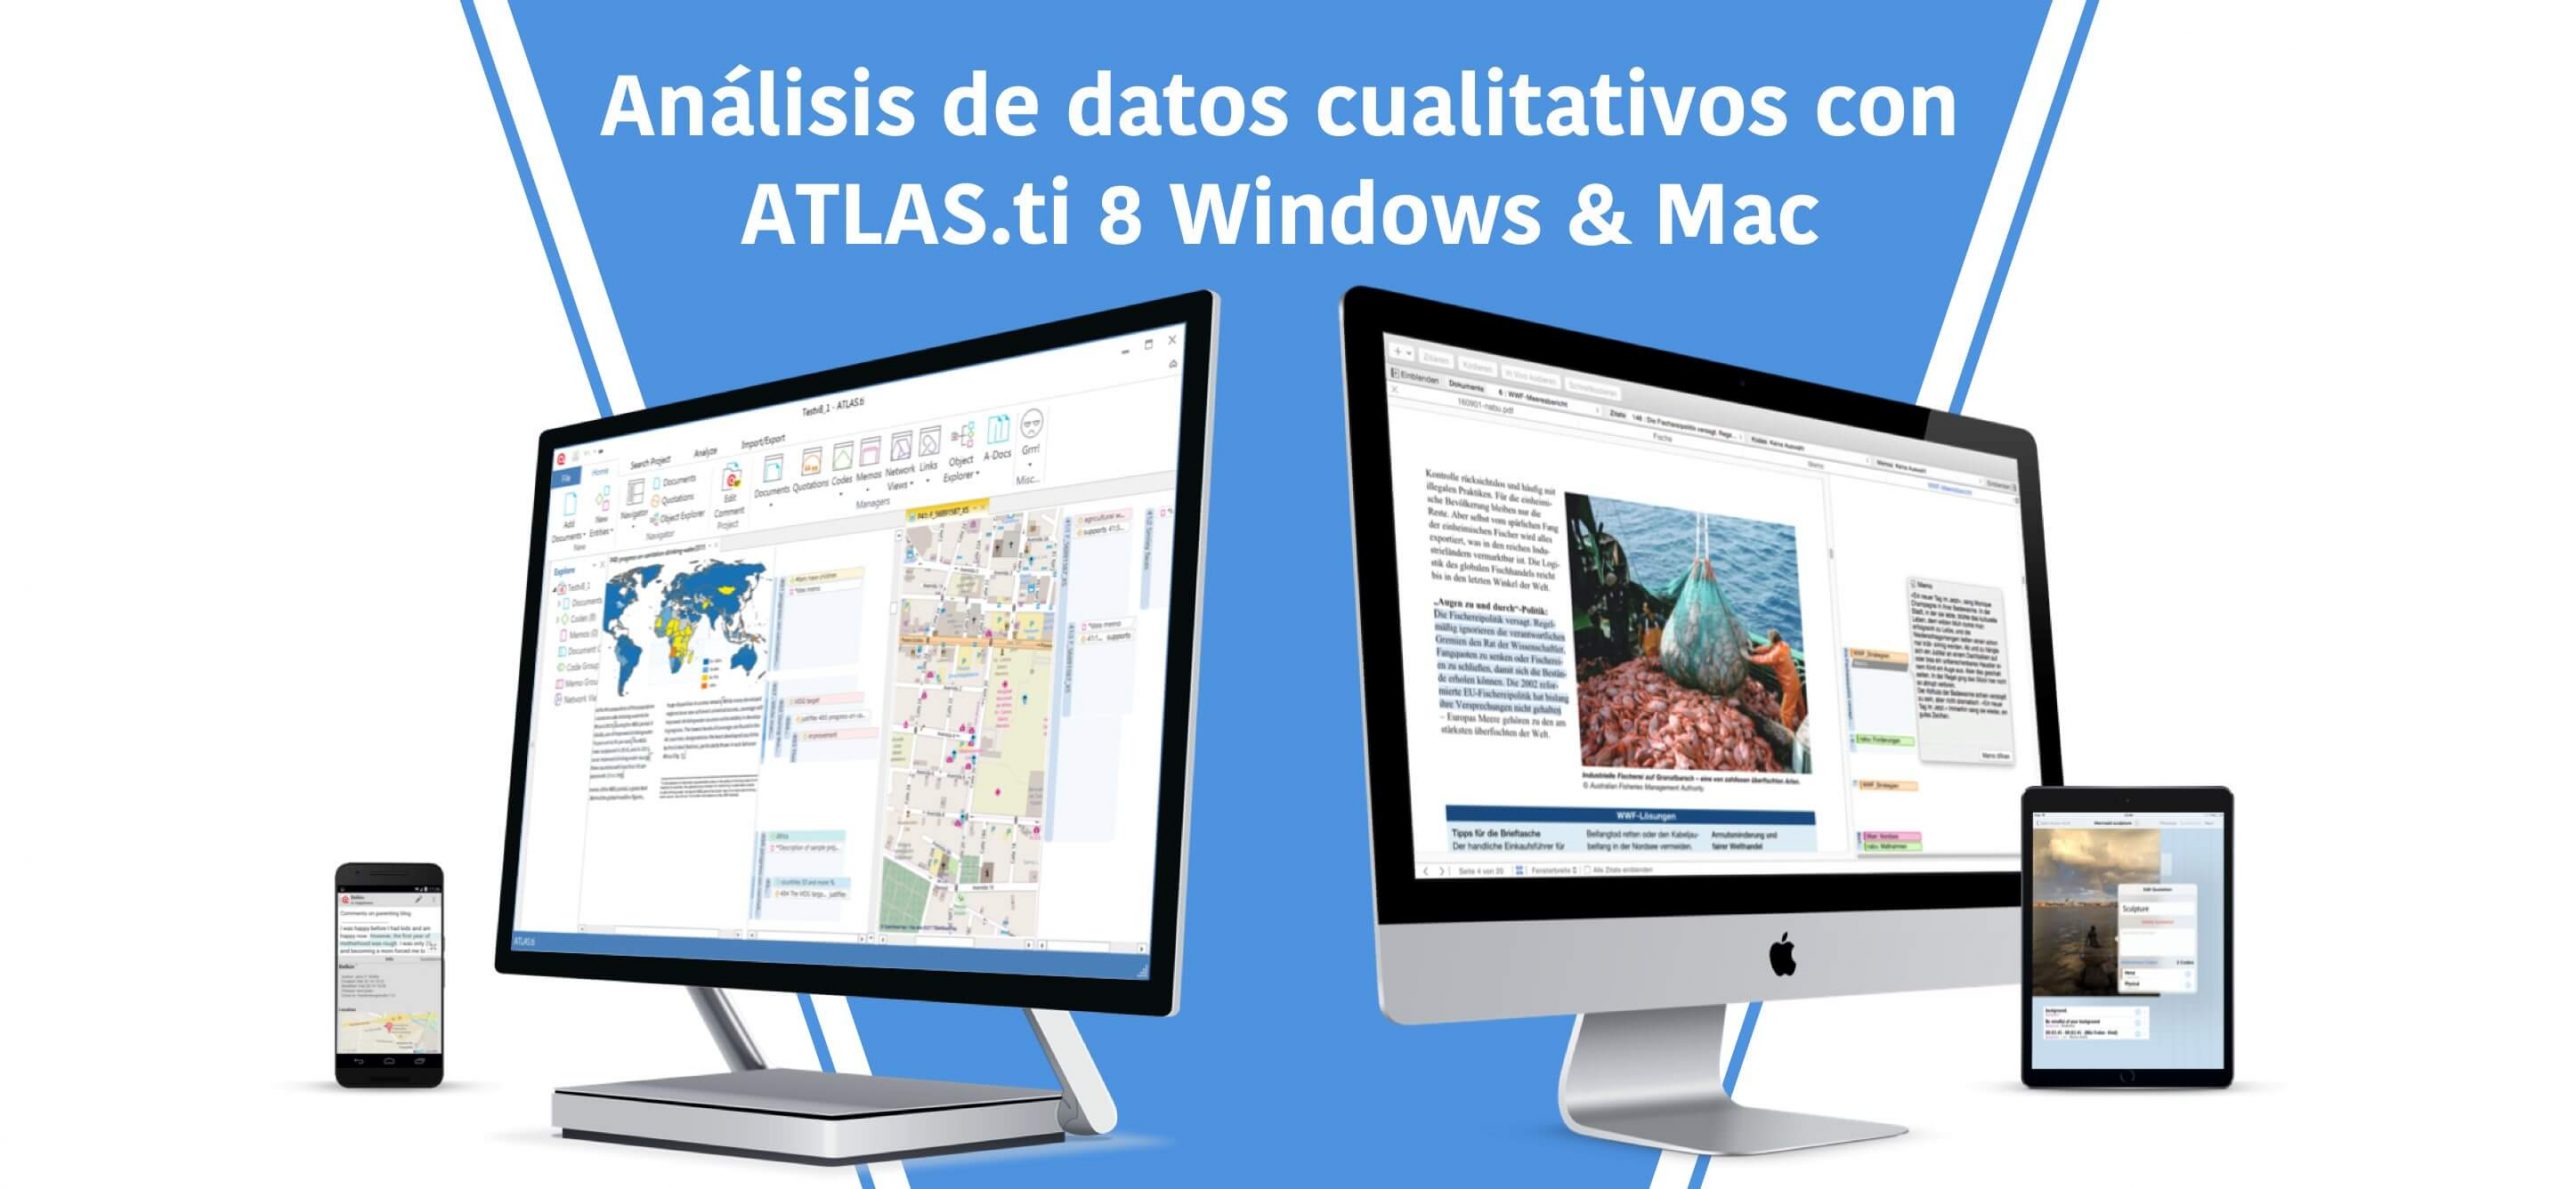
Table of Contents
What is ATLAS.ti?
Qualitative data analysis is a great way to get an in-depth overview of your customers. However, due to its open-ended nature, it’s especially challenging to organize all the data and come up with reliable conclusions. Fortunately, qualitative data analysis software like ATLAS.ti is here to help.
By following the four main principles – visualization, immersion, serendipity, and exploration (VISE) – ATLAS.ti features a user-friendly dashboard where you can easily analyze text, audio, video, and images.
Plus, finding connections and coming to conclusions is simpler due to the software’s various analysis tools and coding features, such as networks, code management, and query functionality. The cherry on top is ATLAS.ti’s broad device support.
You can work on your project on a computer or smartphone and collaborate with team members online with ATLAS.ti Web. Prices start at $50 per month for commercial use, but before you grab your credit card, make sure to try out the software for yourself through the free trial available.
Features
Qualitative data analysis is time-consuming, and a lot of it is spent organizing, coding, and validating your data. ATLAS.ti offers a number of tools to help make the process more straightforward. Of course, the very first step is to import the data into ATLAS.ti.
From text documents to video and audio files, the software supports a wide variety of data. It even imports data directly from Evernote, transcription tools, reference manager software, survey programs, and social media.
In fact, you can have ATLAS.ti collect data from Twitter as long as the tweets have been published within the past week.
But this is only the beginning, as ATLAS.ti shines the most when it comes to organizing and analyzing data. Unlike some of its competitors, the software allows you to set quotations without immediately coding your data.
Instead, you can go over your data, add summaries, and write your interpretations for each quotation without falling into the over-coding trap. Only when you get a sense of the direction your research is going should you start coding your data, making sure each code has at least a few quotations.
Video and Audio Analysis
Qualitative research is more than just reading documents – especially when it comes to marketing. Interviews are a big part of it, and ATLAS.ti comes prepared to help you organize multimedia data smoothly.
If you conducted your interviews online on Microsoft Teams, Zoom, or any other supported platform, you can import the automatic transcripts. That being said, ATLAS.ti also comes with a built-in transcription tool that you can use without the need for third-party software.
Creating quotes, writing memos, and adding comments work the same way as with text. In other words, you can create multimedia quotations while listening to the audio or watching the video with no interruptions.
It’s also possible to code those multimedia quotations to add them to your reports in a later note. Another handy feature is the video snapshot tool. This lets you take a picture of any given frame of the video you’re watching for further analysis.
Making Sense of the Data
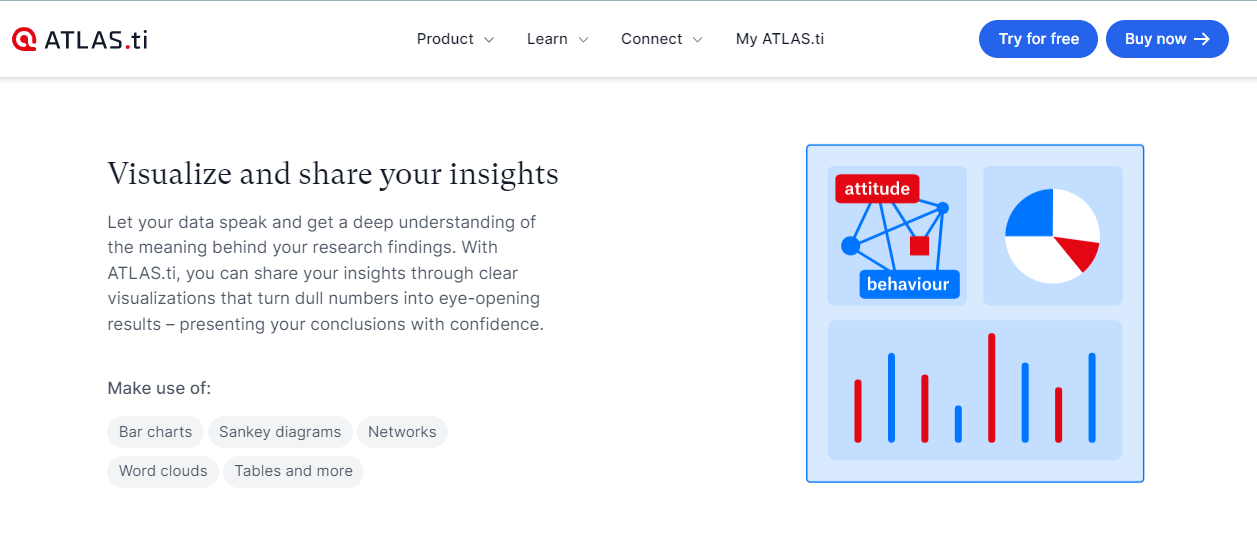
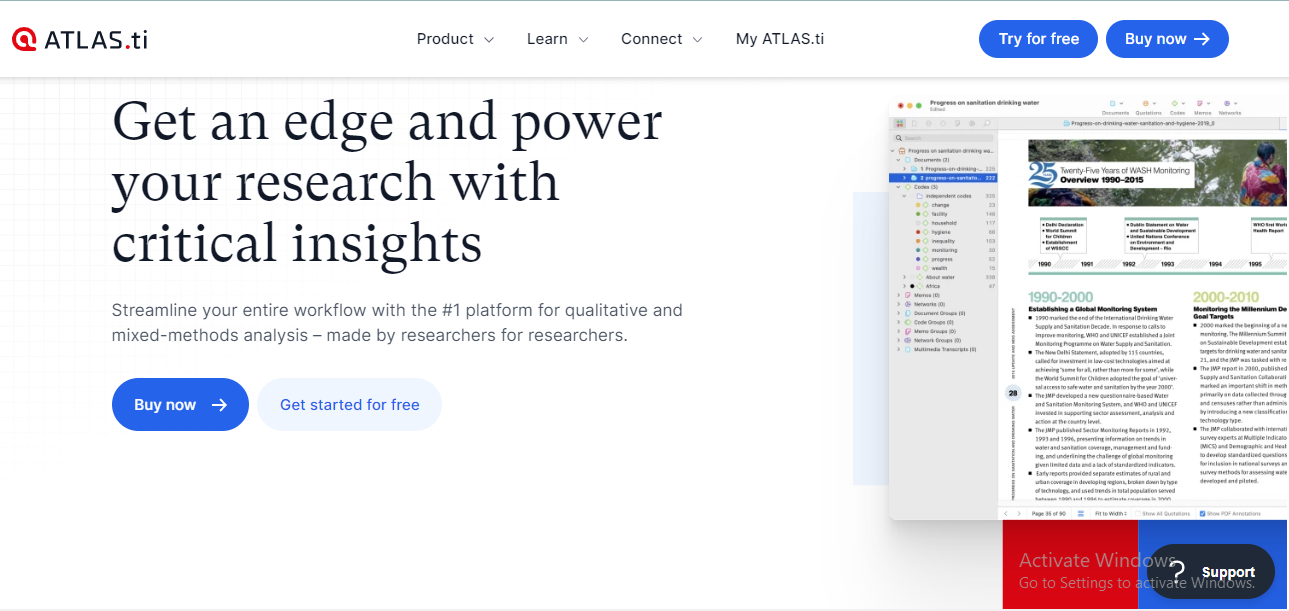
You can have all the information in the world – but if you aren’t able to create correlations, it’s impossible to come up with any conclusions. ATLAS.ti offers various tools to help you interpret your research findings.
One of our favorites is ATLAS.ti Networks, which presents the information visually so you can manipulate and display all entity types of your projects as nodes. This includes quotes, codes, memos, documents – just to name a few. Of course, you can also add all kinds of relations between the nodes.
For example, it’s easy to link a sentence like “qualitative data analysis offers in-depth knowledge of a subject” to the nodes “qualitative data analysis” and “in-depth knowledge”.
Another way to quickly find correlations in your data is by using the code document table, which counts the frequency of codes across documents. The software comes with various settings for you to play with to make sure that the data you’re reading is relevant.
For example, if you’re going through answers by gender and have 15 females and five males, you might want to enable the normalization option. Other analysis tools provided include global filters, smart codes, and code co-occurrence.
Ease of Use
Doing qualitative data analysis is already difficult. So, it’s important that the software you’re using doesn’t make the process even more challenging. Fortunately, ATLAS.ti is quite intuitive.
It also helps that you can do the same thing in different ways, with the software adapting to your work method and not the other way around. For example, you can create quotations by right-clicking the text section or clicking on the corresponding button in the software’s ribbon.
Everything you create on ATLAS.ti (codes, quotations, memos, etc.) comes with its own manager. This is especially important for keeping your workspace organized, as you can group codes, change their colors, add operational definitions to their comments – the sky is the limit.
It’s also simple to export either your entire project or specific sections. With just a few clicks, the software can export information as an SPSS job, statistical data, codebook, or document.
Mobile
ATLAS.ti Mobile InterfaceAlthough data quality analysis requires concentration – which is most likely to happen while sitting at your desk – having your project at your fingerprints is a great advantage.
The ATLAS.ti mobile app is available for Android and iOS, and lets you do everything you would on your computer. In plain English, it’s possible to create new projects, edit text documents, create quotation segments, and much more on your smartphone.
But the best part about the mobile app is the ability to record interviews directly in your project using your smartphone’s microphone and camera. These files can also be automatically given geo-location information if you allow the use of the phone’s GPS tracking function.
Of course, ATLAS.ti updates the project on all devices. This way, you can leave your desk at any time and continue segmenting your project’s data on the go.
Pricing
ATLAS.ti offers licenses for different purposes, which come with various price points. Keep in mind that all the following prices don’t include tax. While students can get ATLAS.ti for the semester for as little as $8.50 per month, education professionals can grab a yearly license for $240 ($20 per month).
Non-commercial and government users also get a discounted rate of $380 per year ($31.67 per month). ATLAS.ti is the most expensive when purchased for commercial use. If it’s just for one user, you can get a monthly or yearly plan.
Bear in mind that the shorter billing cycle only provides access to ATLAS.ti Web and costs $50. The annual plan is the same price per month, but you’ll pay the whole $600 upfront. However, this license allows you to use ATLAS.ti on PC or Mac in addition to the browser version.
Finally, there’s the option to obtain a multiuser license, which can have concurrent or fixed seats. Surprisingly enough, there’s no benefit from an economy of scale. The 5- and 10-user licenses are more expensive per person than the individual subscription, unless you get the 3-year plan that comes with a 35% discount.
You can try out ATLAS.ti through its generous 90-day free trial. For the first five days, you get access to the software’s full capabilities. After that, you can only create projects of limited size.
Customer Support
Although ATLAS.ti is intuitive, the number of features available can be overwhelming. Fortunately, there are plenty of comprehensive tutorials for you to watch and read. If the doorstopper manual with over 190 pages is too much for you, the company also provides a quick and lighter online tour.
Meanwhile, the 1-hour video tutorial is perfect for seeing ATLAS.ti in action. The FAQ section is the place to go regarding license management, billing, troubleshooting, and other common problems.
Directly contacting the company is also an option, which you can do by email and phone on weekdays. You can also reach out to ATLAS.ti on social media via Twitter, Facebook, and LinkedIn. Finally, the company occasionally updates its blog with interesting qualitative data analysis articles, product updates, and more.
Bottom Line
At the end of the day, ATLAS.ti makes something as challenging as qualitative data analysis more accessible. Not only is it easier to organize all the information, but the software’s analysis tools are great for quickly finding correlations.
The platform has a steep learning curve that can be overwhelming for beginners. But the advantages overshadow the disadvantages by a long shot, and ATLAS.ti offers enough tutorials and webinars to help you make the most of the software.
Prices are a bit high, especially considering that committing to a longer period or adding more users doesn’t bring financial benefits. That being said, teams that need to collaborate on projects can save up to 35% by getting a 3-year subscription.
Plus, the 90-day free trial is a great way to test everything out before spending your hard-earned money.

Raymour & Flanigan Review: Is This Furniture Retailer Worth Your Money?

Raymour & Flanigan Honest Review

Squarespace Honest Review for Modern Websites

Envato Elements Review – Features, Advantages, Disadvantages, Pricing Analysis

Is Hostinger Good For eCommerce
